Your central command center for managing center web analytics and content performance
What is the Portal CMS Dashboard?
The Portal CMS Dashboard is your comprehensive analytics and management hub that provides real-time insights into your center's web performance. When users log into the Portal CMS, they are greeted with this dashboard that offers a complete overview of their center's digital presence, visitor behavior, and content performance.
The dashboard is designed to give center managers, administrators, and content creators immediate access to key performance indicators (KPIs), traffic analytics, and content engagement metrics that help them make data-driven decisions about their digital strategy.
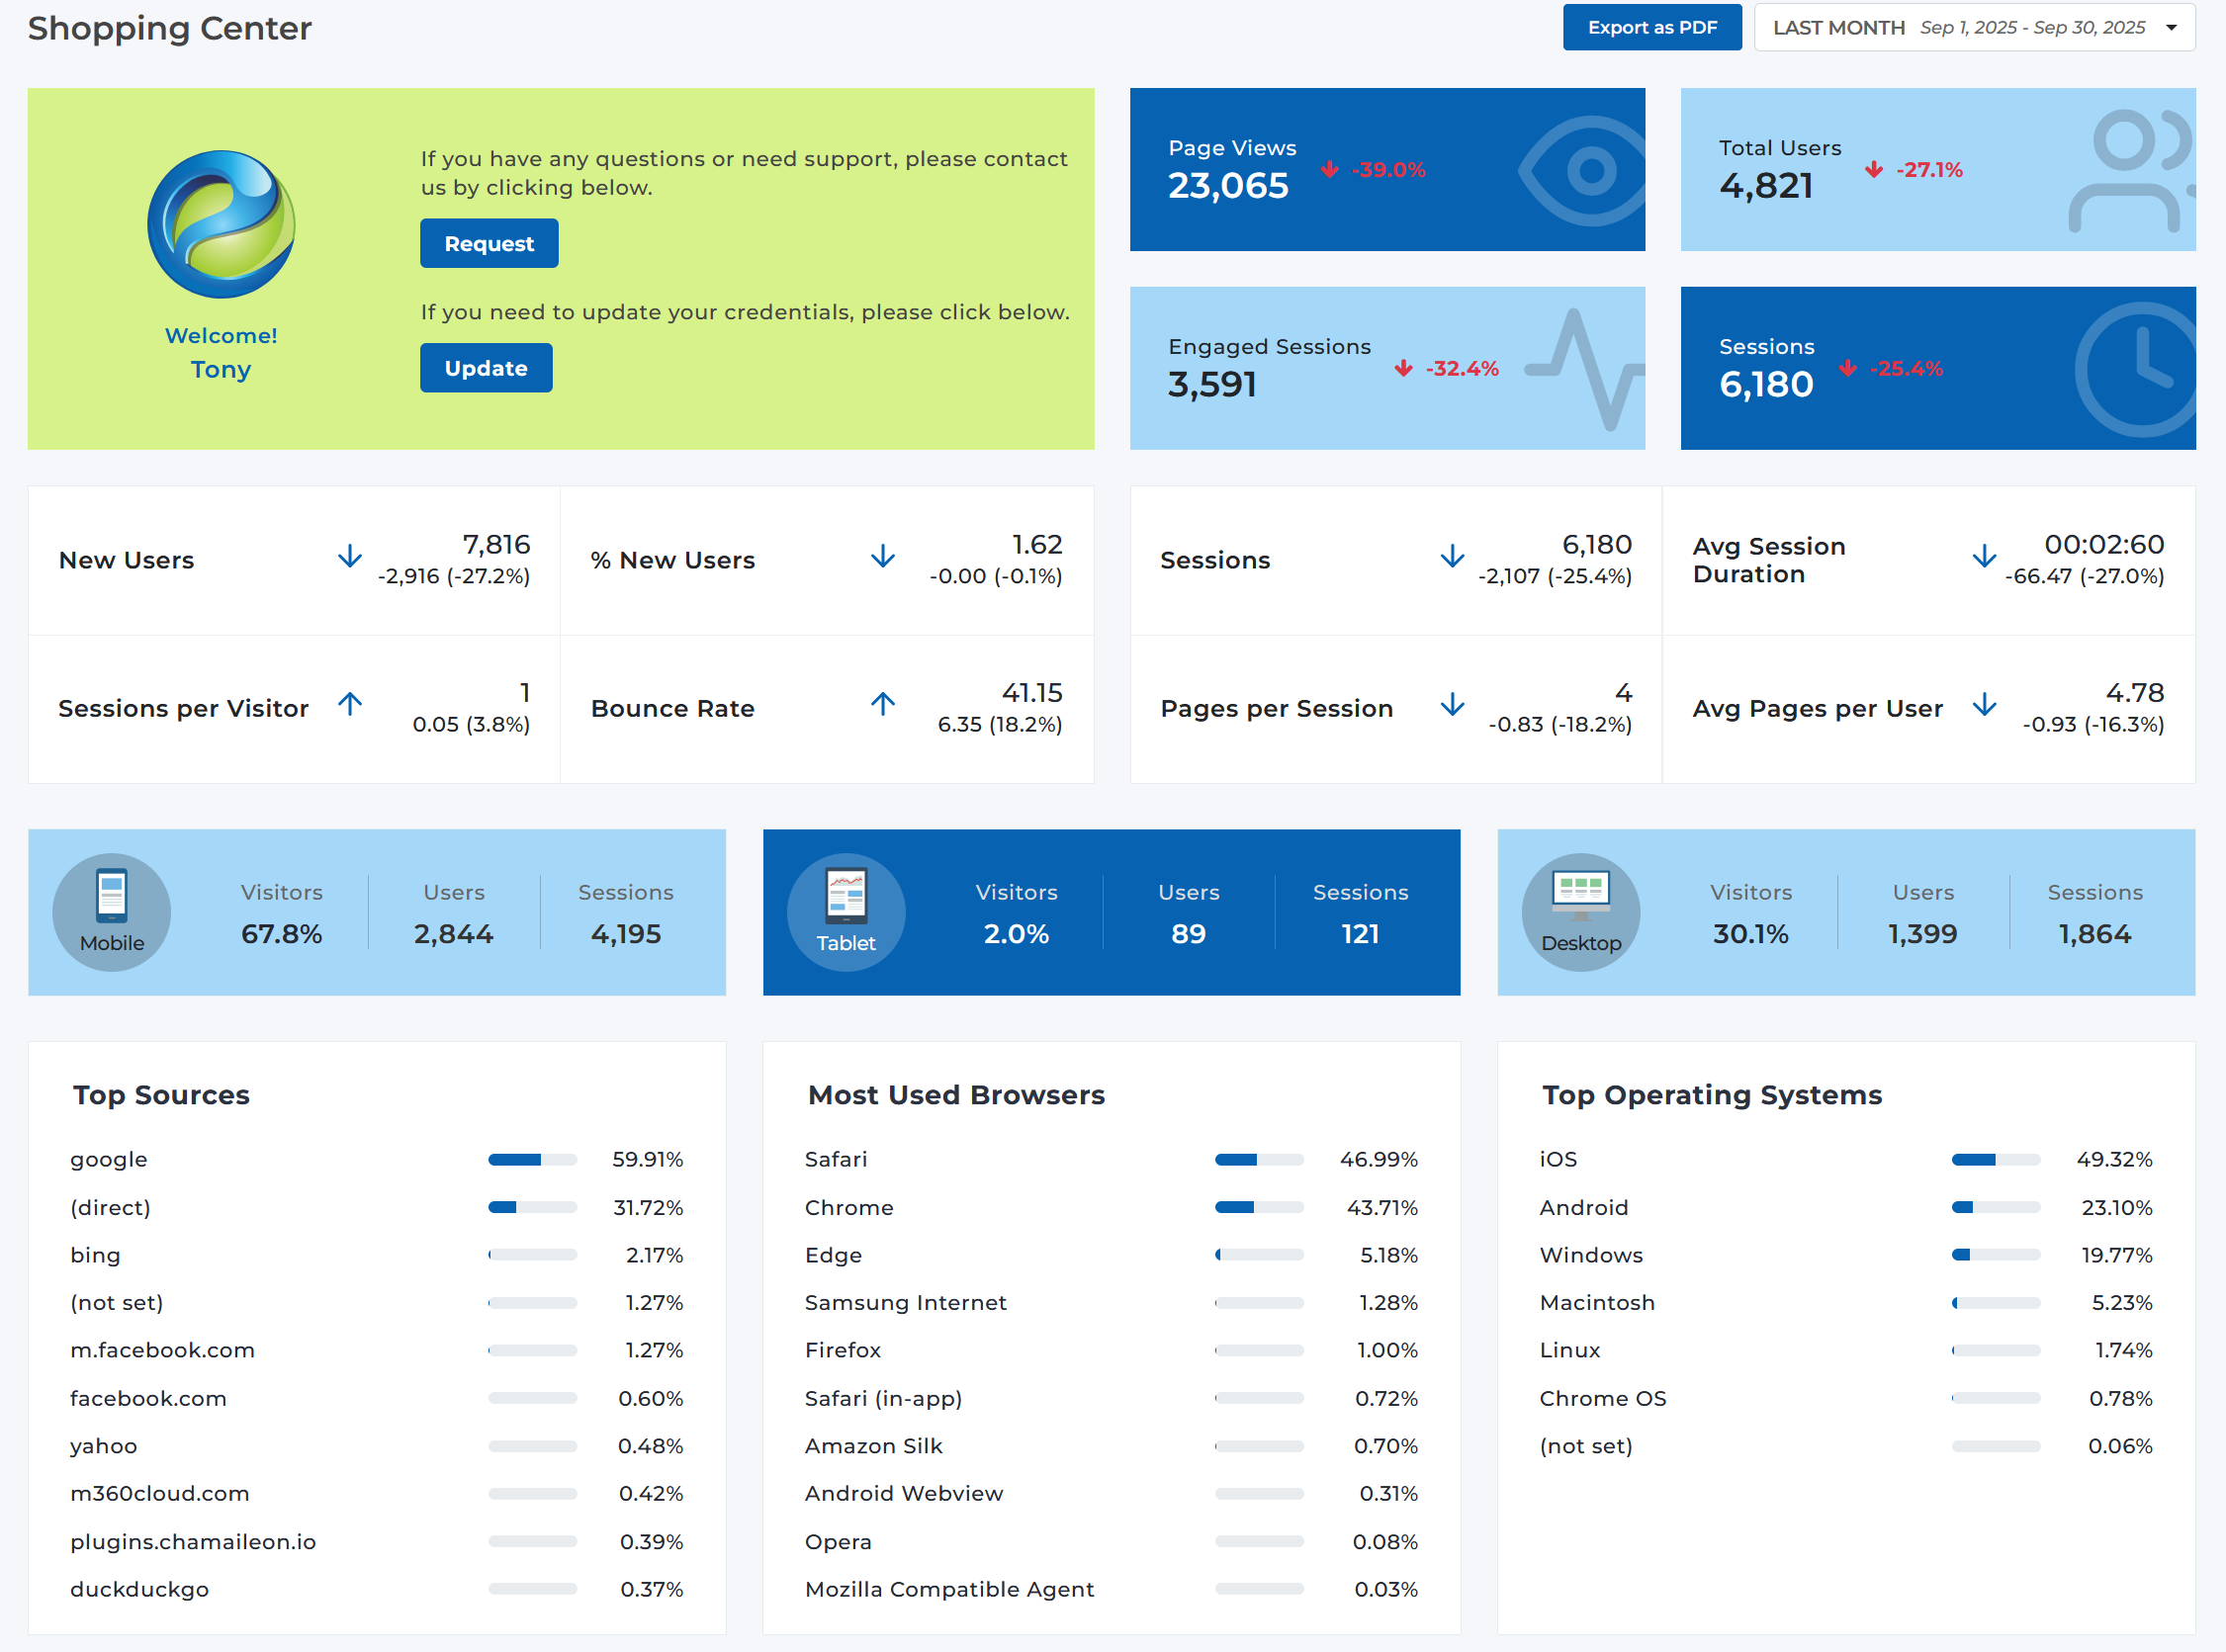
Portal CMS Dashboard - Your central command center for managing center analytics and content performance
Key Dashboard Features
Monitor page views, user engagement, and session data with live updates
Track new users, returning visitors, and user behavior patterns
Understand where your visitors are coming from and optimize accordingly
Analyze which pages, stores, events, and deals are performing best
See how visitors access your content across mobile, tablet, and desktop
Compare performance across different time periods and date ranges
Dashboard Sections Explained
Header Bar
The top header bar provides essential navigation and controls:
- Company/Center Selector: Switch between different companies and centers you manage*
- Date Range Picker: Select specific time periods for your analytics (e.g., "Last Month", "Last 7 Days")
- Export Options: Export your analytics data as PDF reports
- User Controls: Access help, settings, and logout options
Key Performance Indicators (KPIs)
The main KPI cards display your most important metrics with trend indicators:
Primary Metrics
- Page Views: Total number of page visits with percentage change
- Total Users: Number of unique visitors with trend data
- Engaged Sessions: Sessions with meaningful interaction
- Sessions: Total number of user sessions
Detailed Analytics
- New Users: First-time visitors to your site
- Bounce Rate: Percentage of single-page sessions
- Session Duration: Average time spent on your site
- Pages per Session: Average pages viewed per visit
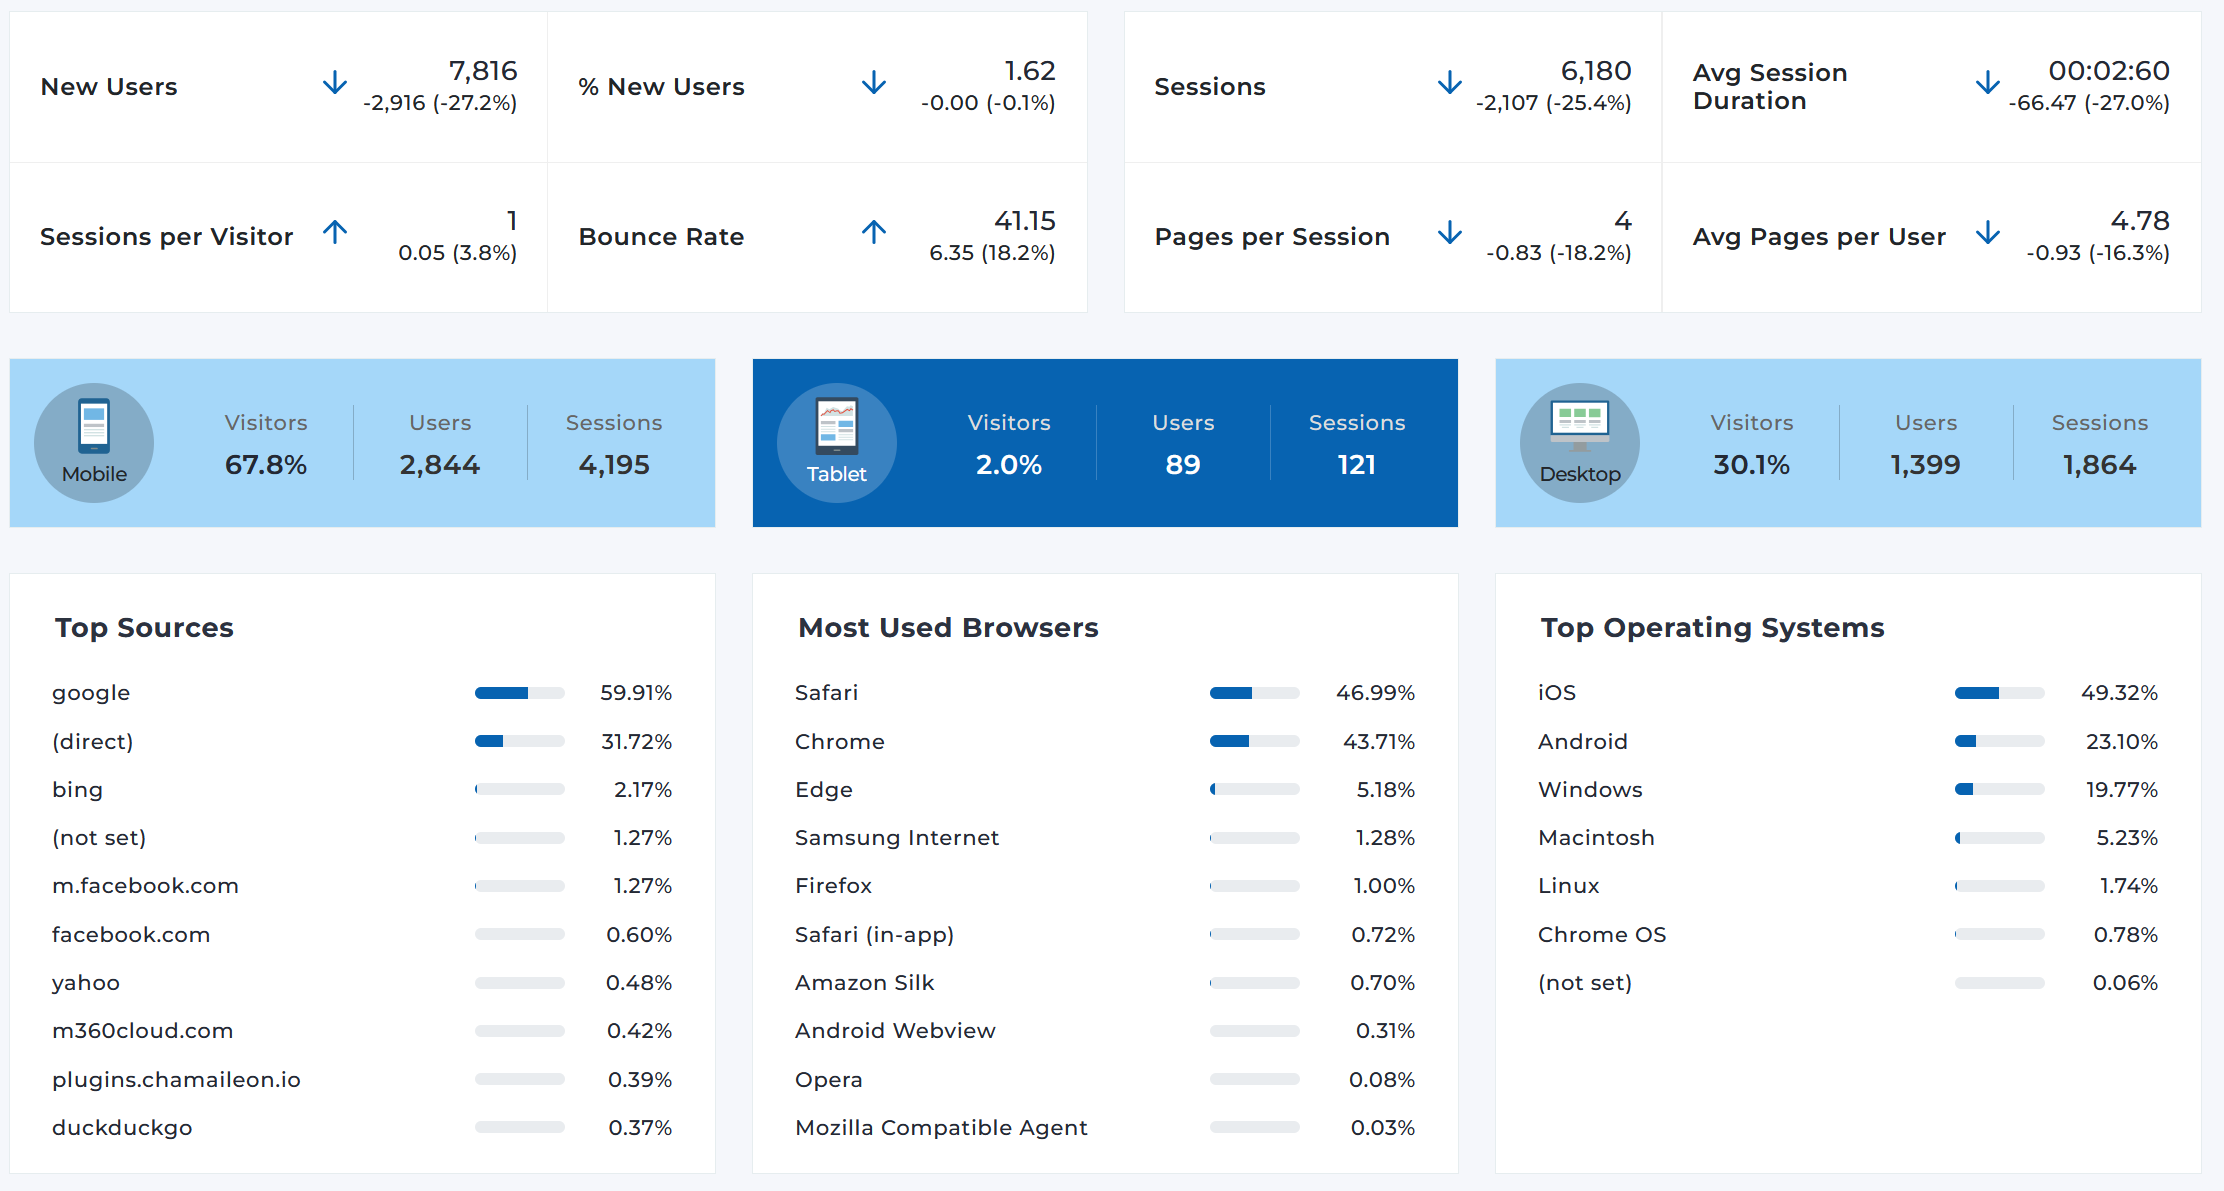
Real-time analytics dashboard with live metrics and performance indicators
Device Analytics
Understanding how visitors access your content across different devices:
Traffic Sources & Technology
Three key areas help you understand your audience and optimize accordingly:
Top Sources
Where your visitors are coming from (Google, direct traffic, social media, etc.)
- • Search engines (Google, Bing)
- • Direct traffic
- • Social media platforms
- • Referral websites
Browser Analytics
Which browsers your visitors use (Safari, Chrome, Edge, etc.)
- • Safari (mobile dominant)
- • Chrome (cross-platform)
- • Edge (Windows users)
- • Mobile browsers
Operating Systems
Device operating systems your audience uses
- • iOS (mobile dominant)
- • Android (mobile users)
- • Windows (desktop)
- • macOS (desktop)
Content Performance Analysis
Four key content areas are tracked to help you understand what resonates with your audience:
Top Pages
Your most visited pages with bounce rates to identify engagement quality
- • Homepage performance
- • Store directory pages
- • Event listings
- • Dining information
Top Stores
Most popular retail locations based on page views and engagement
- • Individual store pages
- • Store-specific content
- • Retailer engagement
- • Store directory performance
Top Events
Most viewed events and special activities driving traffic
- • Special events
- • Meet & greets
- • Seasonal activities
- • Community events
Top Deals
Most popular promotional offers and discounts
- • Store promotions
- • Seasonal sales
- • Special offers
- • Discount campaigns
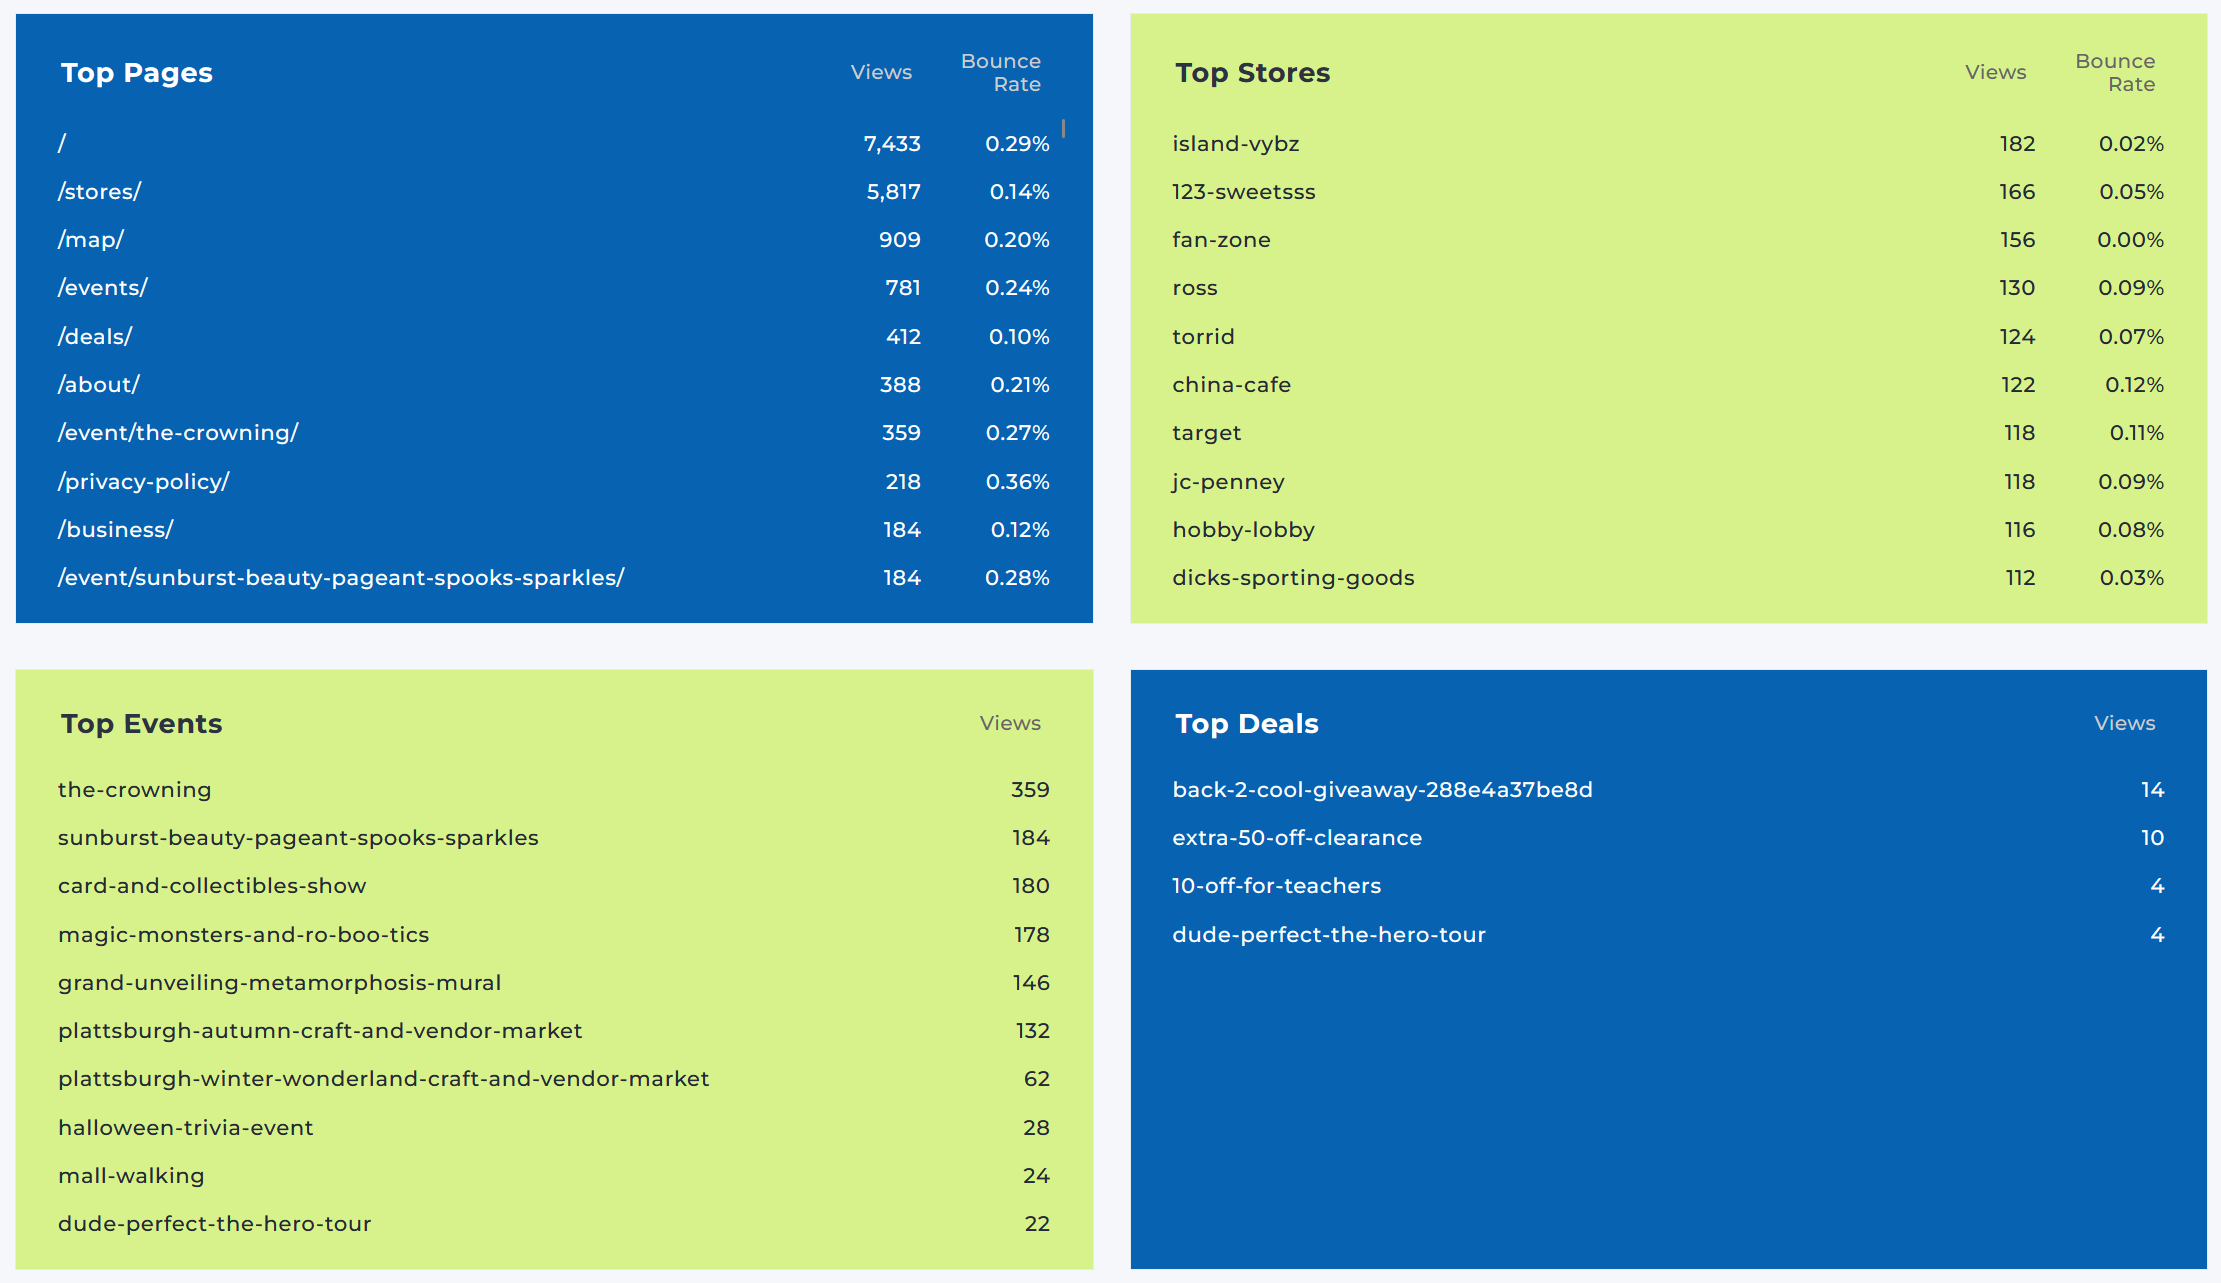
Content Performance Analysis - Track top-performing pages, stores, events, and deals
Dashboard Best Practices
Regular Monitoring
- • Check daily for traffic spikes or drops
- • Monitor bounce rates for content quality
- • Track device usage trends
- • Review top-performing content weekly
Data-Driven Decisions
- • Use traffic source data for marketing focus
- • Optimize content based on top pages
- • Plan events around popular time periods
- • Adjust mobile experience based on device data
Ready to Explore Your Dashboard?
Log into the Portal CMS to access your personalized dashboard and start analyzing your center's performance.
Access Portal CMS Dashboard